I had to do a double take when I saw Lemmy.ca spiked to 9.1k registered users
I had to do a double take when I saw Lemmy.ca spiked to 9.1k registered users
They must be those cool folks from r/onguardforthee and r/fredericton! Lets get off those american Reddit servers eh!
Update: there’s a thread on r/buycanadian with 93 upvotes, promoting the platform! Open the floodgates baby!
You're viewing a single thread.
I did some playing around with grafana. This data is all just number of signups per day, grouped by instance.
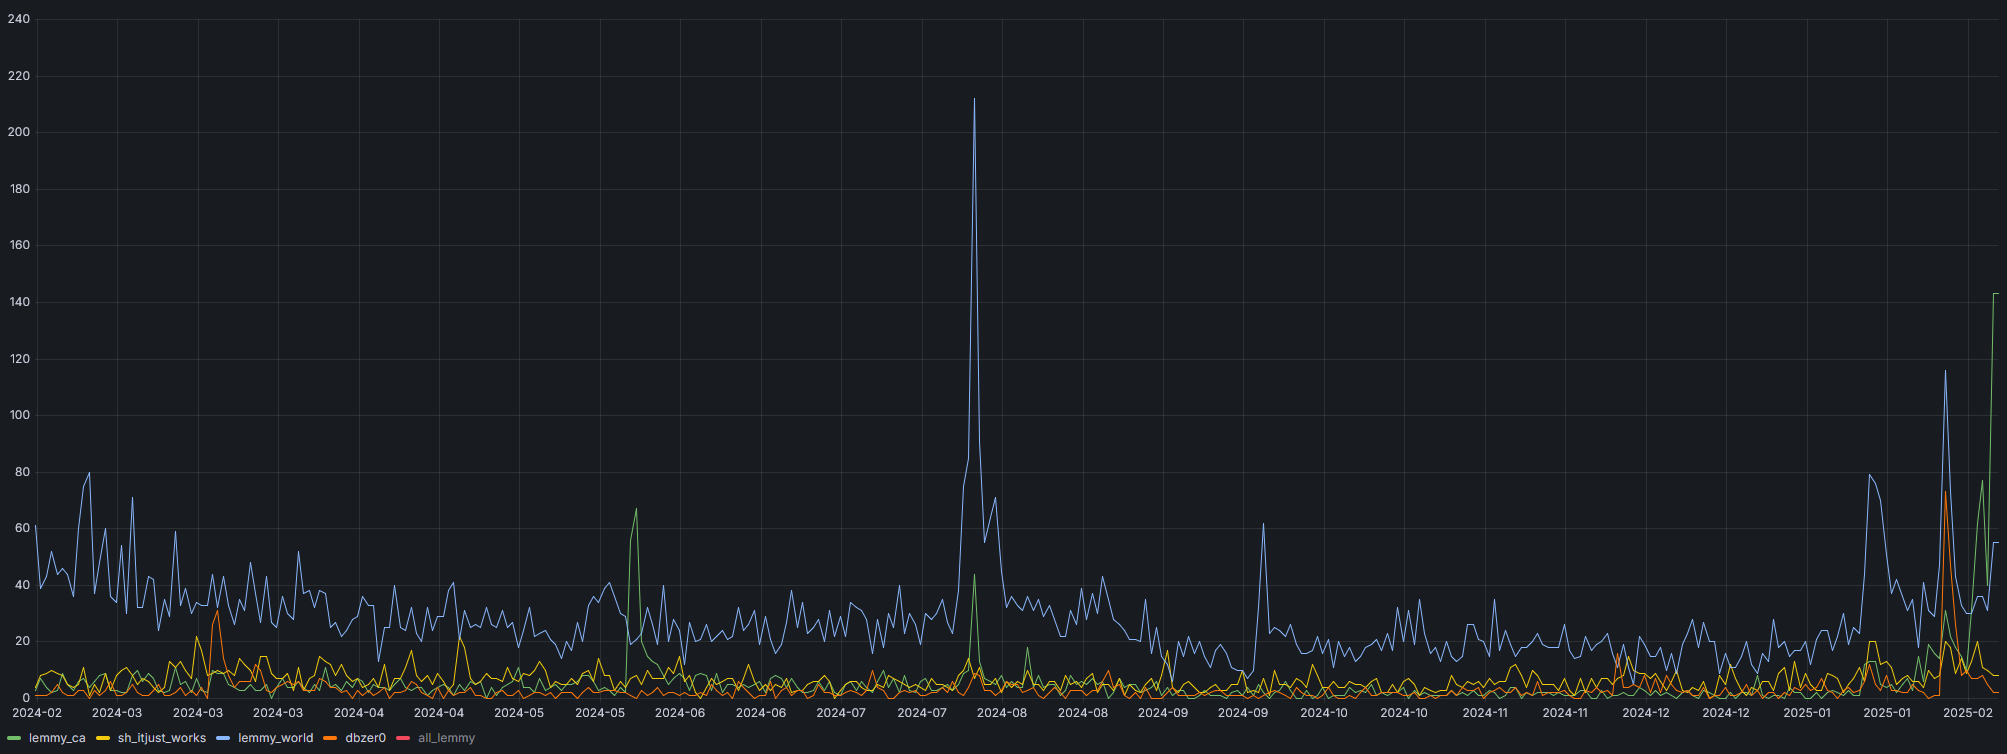
Here you can see our recent spike in users compared to normal:

Adding in some other large instances we all got an increase in traffic, but ours seems to be more sustained:
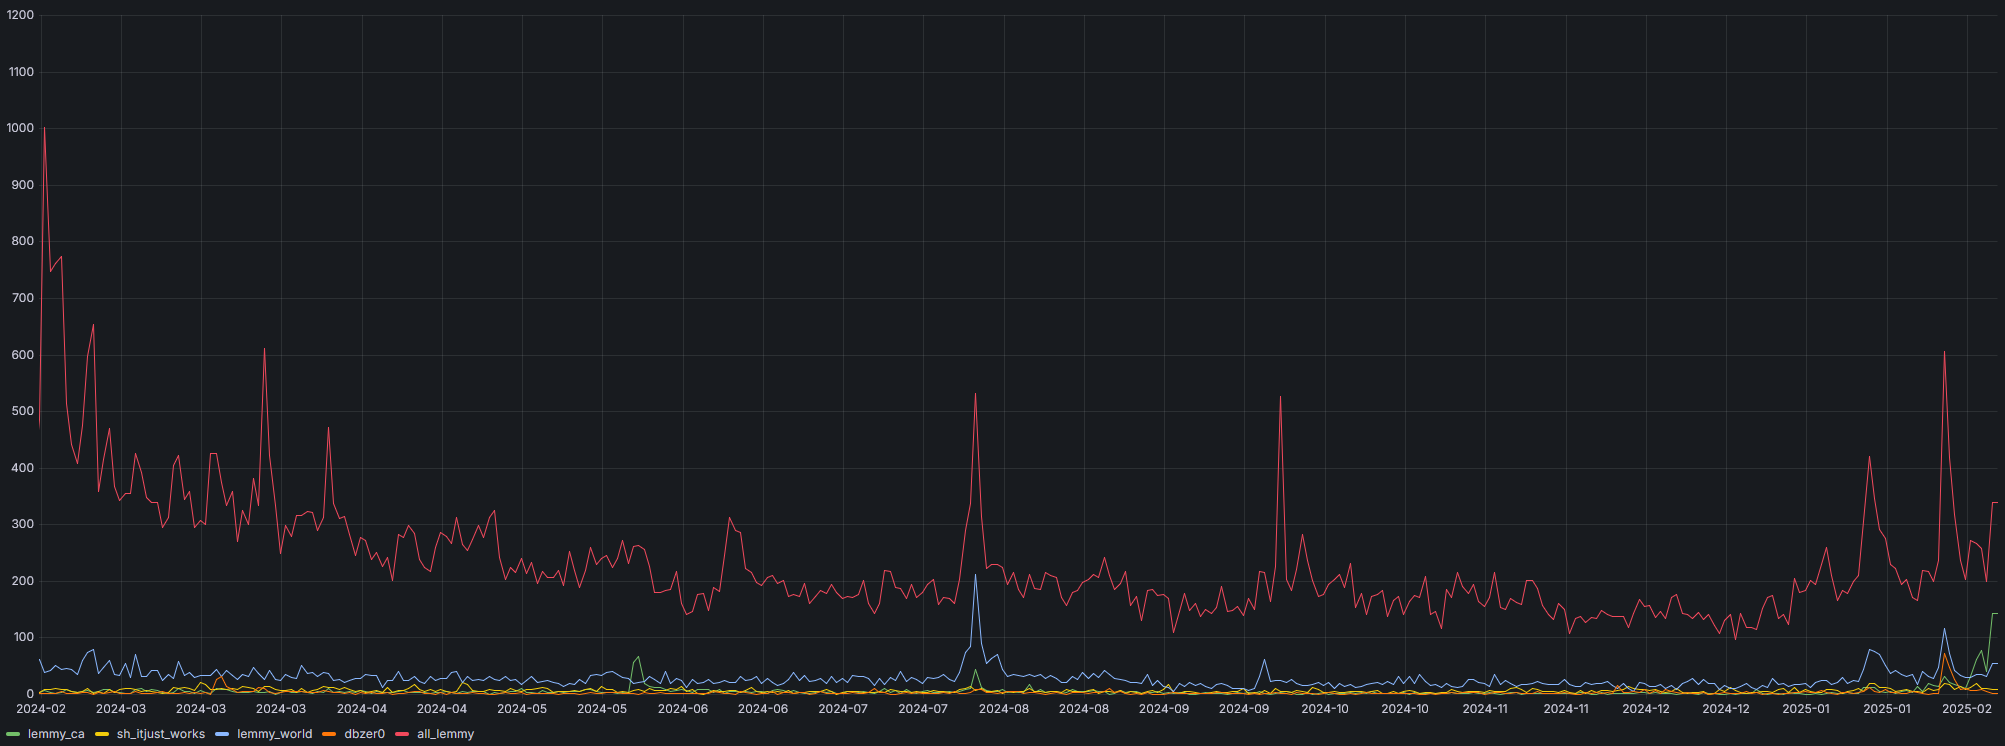
And for completeness, compared to all of lemmy (as visible by lemmy.ca, so only things we federate with):
Reddit's announced some more changes but I suspect the whole tariff situation is pushing Canadians extra hard.
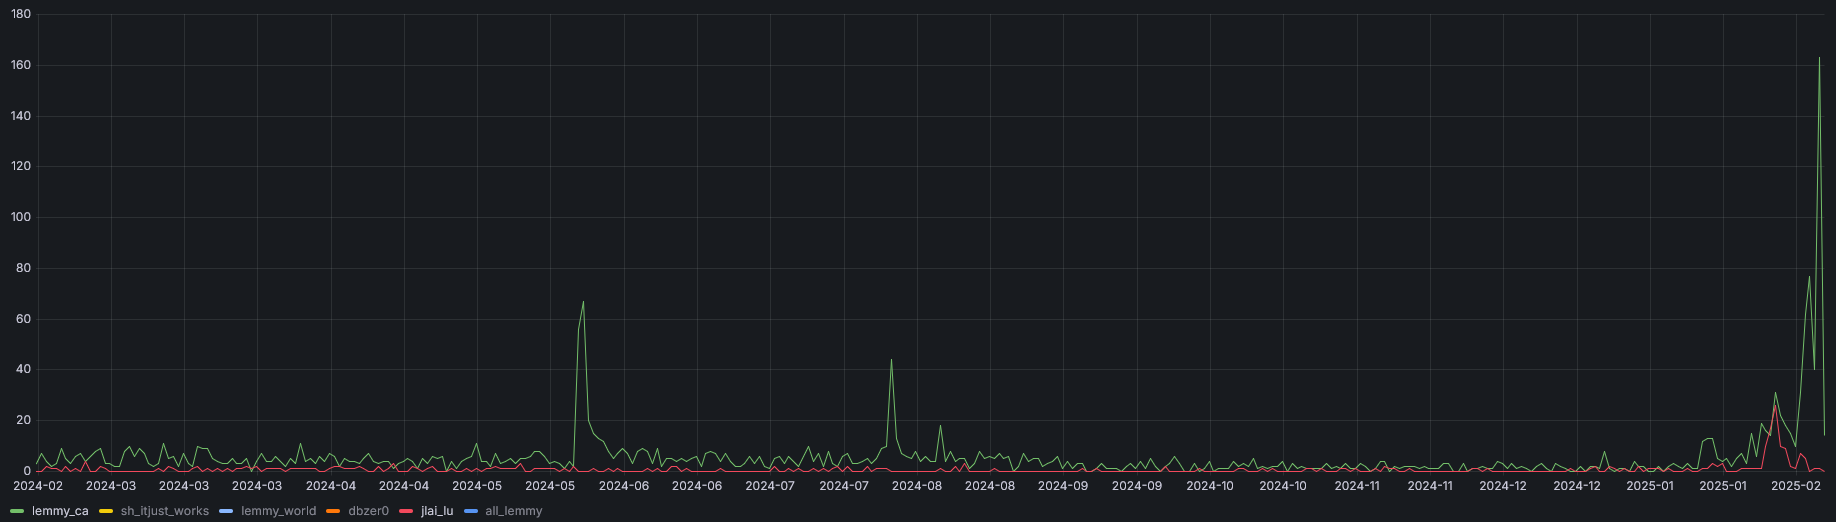
Is this grafana public? I'd like to check for jlai.lu, we also had a recent influx of users.
No, I want to start exposing a grafana instance but for now I'm keeping this internal since it hits our live postgres.
The query if you want it is:
SELECT
  DATE(published AT TIME ZONE 'UTC') AS date,
  COUNT(*) FILTER (WHERE instance_id IN (SELECT id FROM instance WHERE domain = 'lemmy.ca')) AS lemmy_ca,
  COUNT(*) FILTER (WHERE instance_id IN (SELECT id FROM instance WHERE domain = 'sh.itjust.works')) AS sh_itjust_works,
  COUNT(*) FILTER (WHERE instance_id IN (SELECT id FROM instance WHERE domain = 'lemmy.world')) AS lemmy_world,
  COUNT(*) FILTER (WHERE instance_id IN (SELECT id FROM instance WHERE domain = 'lemmy.dbzer0.com')) AS dbzer0,
  COUNT(*) FILTER (WHERE instance_id IN (SELECT id FROM instance WHERE domain = 'jlai.lu')) AS jlai_lu,
  count(*) as all_lemmy
FROM person
GROUP BY 1
ORDER BY 1;
Or here's your instance overlayed with us to provide a comparison:
A suggestion from someone who frequently deals with observability infrastructure: it's a good idea to set up a postgres exporter and record your data as Prometheus metrics, that way querying the metrics does not hit any of the production stack.
Prometheus is the goat, and is built into a surprisingly large amount of FOSS service tools. JupyterHub for example includes Prometheus metrics out of the box
Eh. Calling it the goat is excessive. I'm planning to go victoriametrics instead.
Yes the exporter format is common and widely supported though, which is nice.
Nice, thank you!