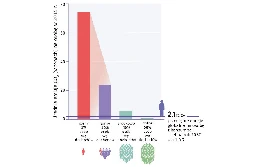
Osobisty ślad węglowy w zależności od dochodów
Osobisty ślad węglowy w zależności od dochodów
Średnie emisje dwutlenku węgla na osobę (osobisty ślad węglowy) w 2015 r. w zależności od dochodów.
@wounded_knee Trochę nie rozumiem jak wysokość zarobków ma się do śladu węglowego. Chodzi o jakieś statystyczne dane? Bo sam proces zarabiania / przekazywania pieniędzy chyba nie ma jednoznacznego wpływu.
O jakim obszarze jest mowa?Mogę się domyślać, że chodzi o to, że najbogatsze kraje na świecie najbardziej brudzą, a te biedniejsze i bardziej zaludnione dużo mniej?
Z tego co rozumiem to w ogóle jest liczone w dość śmieszny sposób. Wykres z Emissions Gap Report opiera się na wyliczeniach Oxfamu i SEI (https://oxfamilibrary.openrepository.com/bitstream/handle/10546/621049/rr-carbon-inequality-era-210920-en.pdf), które to, na ile dobrze zrozumiałem, polega na tym, że emisje całego kraju rozdzielamy między poszczególne osoby zakładając że ślad węglowy rośnie z dochodami w określony sposób. Natomiast założenie to jest uzasadnione przez powołanie się na wcześniejsze publikacje. I o ile pojawia się dużo trudnych słów których nie rozumiem, to jasne jest, że część tych badań to są statystyki (no i taka relacja ma sens tylko w wersji uśrednionej, bo teoretycznie jest możliwe, żebym zarabiał miliardy i przeznaczał wszystko na zalesianie, elektrownie odnawialne i atomowe oraz stypendia dla klimatologów).
Third, we assume that between the upper and lower bounds discussed above, emissions rise monotonically with income, and that the relationship can be expessed as an elasticity of emissions with respect to income. Depending on income-dependent consumption behaviour in a given country, emissions may grow faster than income (elasticity >1), in proportion to income (e=1), or more slowly than income (elasticity <1). The same approach was taken by by Baer et al. (2008), Chakravarty et al. (2009), Chancel and Piketty (2015) and Gore (2015). This assumption is grounded in the findings of numerous studies relating income, consumption, energy use and/or emissions, which draw upon a variety of methodologies (see for example Wiedenhofer et al. 2013; Ummel 2014; Hubacek et al. 2017; Wiedenhofer et al. 2017; Dorband et al. 2019; Song et al. 2019; Li et al. 2020; Oswald et al. 2020; Ivanova and Wood 2020). Some studies are based on consumption surveys of a set of households that span a range of incomes, coupled with national input-output matrices and emissions coefficients, or sometimes coupled with estimates from lifecycle analysis. Others are done through either partial or whole-economy general equilibrium modelling, and some assessing carbon tax incidence also purport to calculate indirect market-mediated effects, which is extraneous to an analysis of current consumption-based carbon emissions. Some additionally account for any of various mechanisms for revenue recycling (e.g., per capita dividend), which can also be neglected for our purposes.
Brakuje mi kontekstu, w jakim % jest osoba która np. zarabia minimalną/średnią pensję w Polsce. Tutaj udało mi się znaleźć artykuł, według którego wystarczy posiadać majątek o wartości 100 000$, żeby zaliczać się do górnych 10%
Nie posiadam żadnych danych na poparcie swoich slow, ale kiedyś czytalem, że mnóstwo obywateli Polskiej znalazłoby się w tych najbogatszych 10%.
nie wiem, kto to wymyśla, ale tak na logikę, uwzględniając, jak dużo dzieciaków leci obecnie na pieluchach jednorazowych, chusteczkach nawilżanych, mleku modyfikowanym, jedzeniu z tubek itp. - to coś z tym założeniem jest nie tak, bo ślad węglowy zostawiają ogromny, a przez najbliższe 20 lat raczej żadnych dochodów mieć nie będą