How do you deal with the logs on your servers?
How do you deal with the logs on your servers?
I'm pretty new to selfhosting, but one thing that I know to take seriously is log collection. Since there are a lot of different type of logs (kernel log, application logs, etc) and logs come in many different formats (binary, json, strings) - it's no easy task to collect them centrally and look through them whenever neccessarly.
I've looked at grafana and tried the agent briefly, but it wasn't as easy as I thought (and it might be a too big tool for my needs). So I thought to ask the linuxlemmy community to get some inspiration.
Nothing. I always use the standard configuration from the services I've installed. If something doesn't work I go into those logs and look what's wrong.
Heh. Kickin' it old skool. Nice.
Honestly? I just ignore them. Something seems to be happening to them, as they're not growing infinitely, but no idea why.
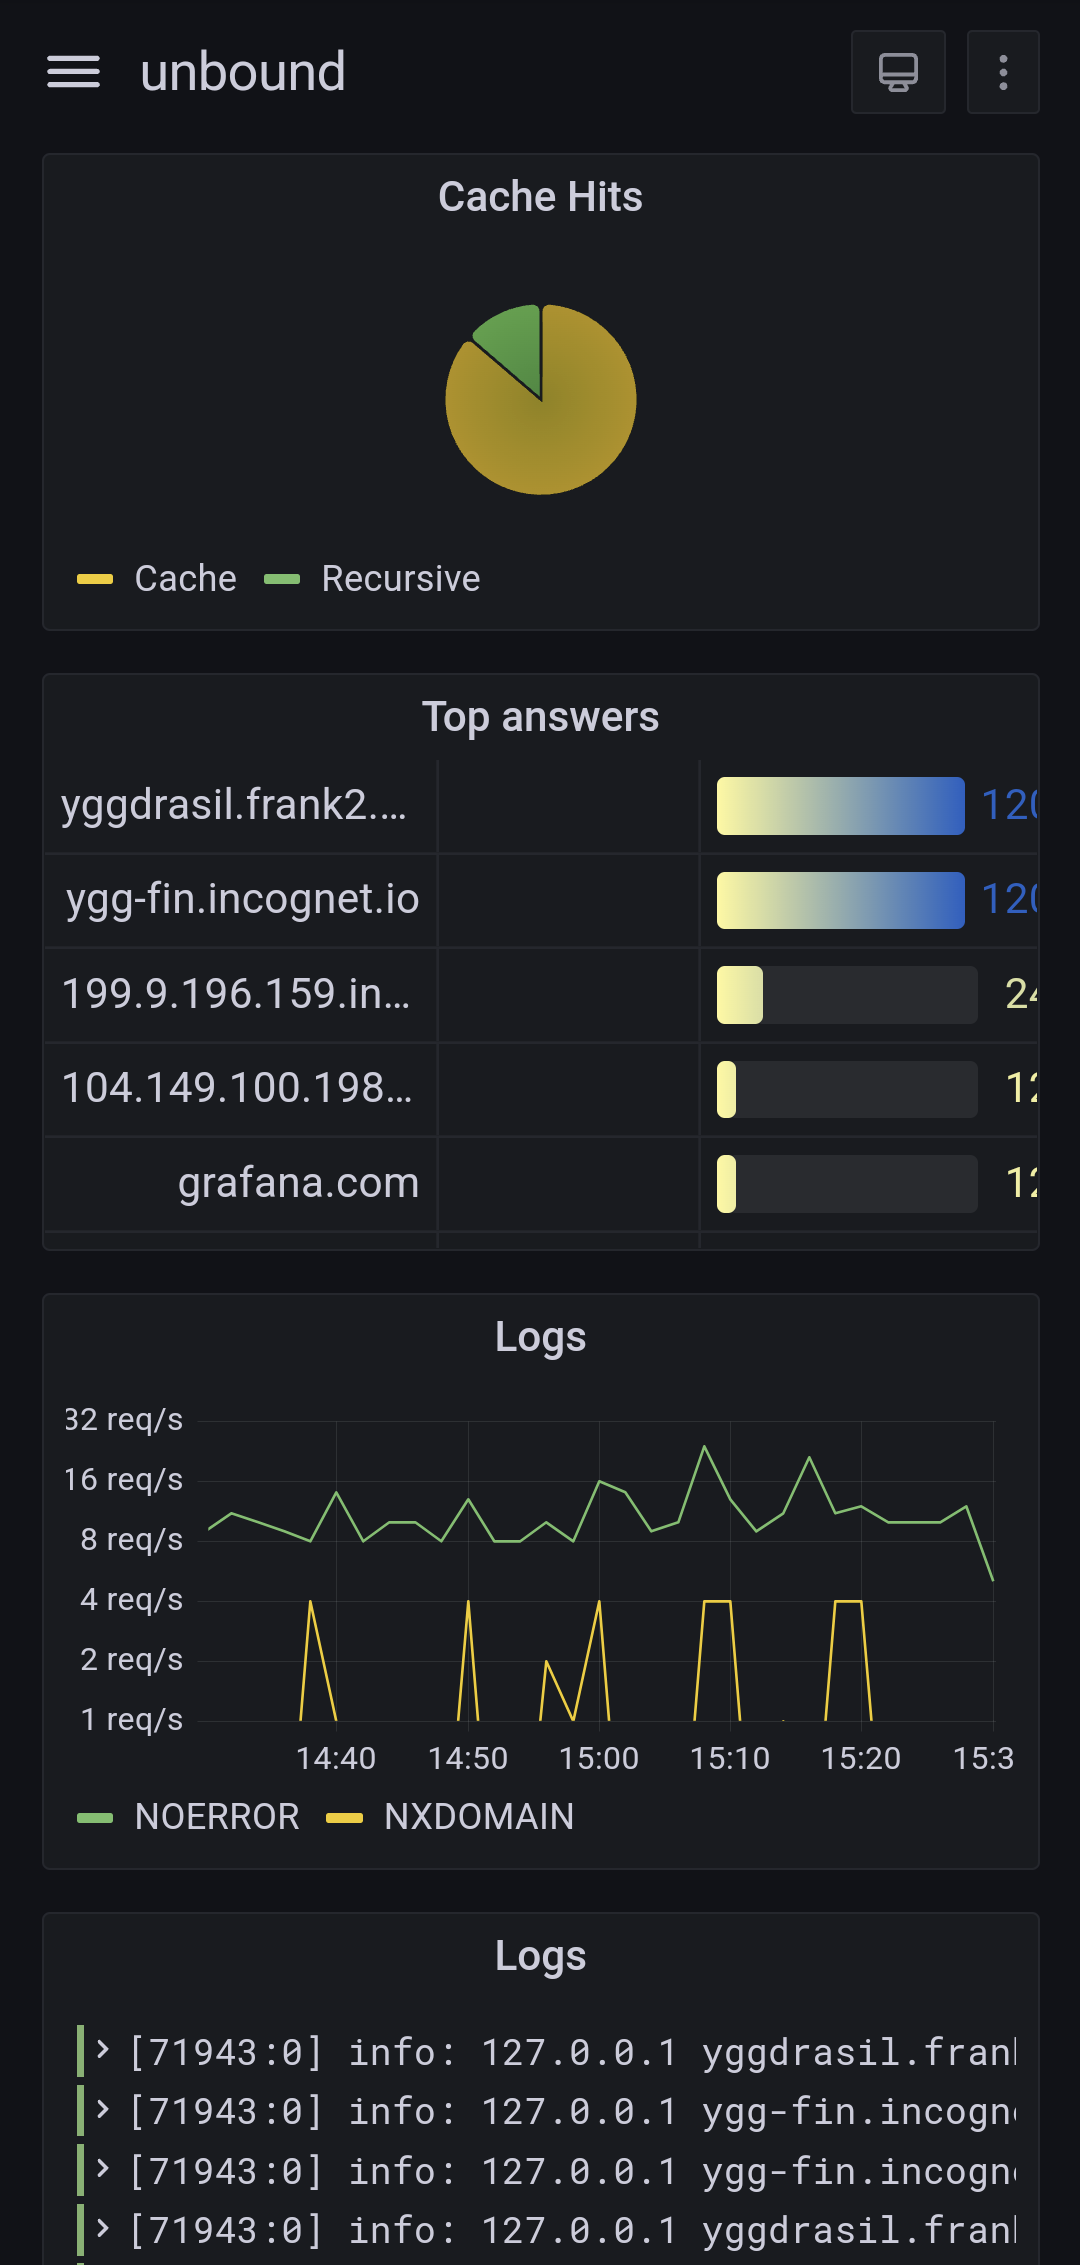
It was a bit complicated to set this up, but it took me almost no time at all.
Ah yes, I’ve answered a number of support questions from people who have used this method and don’t understand why their app quit working.
I haven't done the math, but I can count the times a service stopped working and I had to delve into the log files on one hand. The most difficult part usually is setting them up, and as soon as that's done, usually they keep running indefinitely. I'm relatively sure that researching ways to "properly" handle log files, visualizing them, actually setting it up etc, is much much more time investment than the few times that stuff actually breaks and you'd need any of that and it saves any time.
At least for personal stuff. For more critical services, of course it makes sense.
I've just started digging into it myself ! Here's my current setup (I'll see how it scales in the long term):
- syslog on every host
- Telegraf collects and parse logs
- InfluxDB stores everything
- Grafana for dashboards
I run OpenBSD on all my servers, and configure all the services to log via syslog.
Then I configuré syslog to send only those I care about (https, DNS, ...) to a central telegraf instance, using the syslog protocol (RFC3164).
On this collector, telegraf gets all these logs and parse them using custom grok patterns I'm currently building, to make sense out of every log line it receives. The parsed logs are in turns stored in Influxdb, running on the same host.
I then use Grafana to query InfluxDB and create dashboards out of these logs. Grafana can also display the logs "as-is" so you can search through them (it's not ideal though as you simply search by regex from the full message, so it's on par with grep at least).
This setup is fairly new and seem to work very well. Telegraf is also very low on resource usage for now. I'll have to continue adding grok patterns and send more application logs to it to see how it handles the load. I do have a few questions still unanswered for now, but time will tell:
Q: Should I first collect via a central syslog before sending to telegraf ?
This would let syslog archive all logs in plain text, rotate and compress them. I would also only have a single host to configure for sending logs to telegraf. However this would eat up space, and could hide the original sending hostname for each log. I might try that someday.Q: Should I run telegraf on each host ?
This would distribute the load of the grok parsing amongst all hosts, and then all telegraf processes will send directly to the central one for collection, or even directly into influxdb. I would also benefit from telegraf being install on each host to collect more data (CPU, network stats, ...). However it makes the configuration more complex to handle.Q: What is a good retention period ?
For now, influxDB doesn't expire any data, as I don't have much yet. In the long run, I should probably delete old data, but it's hard to tell what is "old" in my case.Q: Do I need an interface to read logs ?
I use this setup mostly for graphs, as grafana can make sense of fields like "http_verb", "http_code" and such. However, it is much more practical for me to dig into the logs right on the server, in/var/log. Having an interface like chronograf or graylog seems practical, but I feel like it's overdoing it.Bonus:
Nice! If you'd write a guide on your setup, I'd be all over it (along with others I'm sure) 😀
You'll want to check this out: https://www.tumfatig.net/2022/ads-blocking-with-openbsd-unbound8/
That's the post I took inspiration from for this setup. It does use collectd and custom awk scripts for log ingestion though, where I simply use telegraf.
Is this for a homelab or commercial hosting?
In terms if logging: sys journal does the job for me ...
I do run prometheus + grafana for some services but that is mostly for some fancy looking graphics nothing really usefull.
I would recomend you to monitor updates of you apps so you are well informed when und what to update (i just have subsribed to all the diffrent release git rss feeds)
Personally I use Loki to aggregate my logs but I'm probably not the typical selfhoster.
You should first define your needs, if you don't need logs, then don't bother with them.
For a bit enhanced log file viewing, you could use something like lnav, I think it's packaged for most distributions.
Cockpit can be useful for journald, but personally I think GUI stuff is a bit clunky for logs.
Grep, awk and sed are powerful tools, even with only basic knowledge of them. Vim in readonly mode is actually quite effective for single files too.
For aggregating multiple servers' logs good ol' rsyslog is good, but not simple to set up. There are tutorials online.
I've been using Loki and promtail for containers I actually care about aggregating logs for. It's something relatively new for me but so far the experience has been positive.
Any specific guide you followed?
Systemd does all that for you. Just set a limit in journal.conf
So does syslog; and really well. Logging is just another thing Lennart tried to take over from a working system, that he and Kay half-delivered, and wandered off. See also: nfsroot, fast boots, easy init config, nfs mounts in general, and cron.
OK boomer
You could try deploying an ELK stack and manage log collection using Elastic Agents and integrations, works pretty well for us and, as long as your log is supported by an integration, it’s dead simple to manage
And if you need to take a look at it, you'll really appreciate the convenience and ability to query.
I use the standard system syslog with logrotate every 7 days with 1 month of gzip archive.
However on production systems, I run a central rsyslog server which archives once a week and a year of archives. Considering ELK in the future but for simple retention syslog is fine.
My logs were actually filling up my disk! I edited journald conf and limited them to 500mb . disk is only 10gb for reference
What services were you running and for how long? I ask because I rent a very cheap VPS with 10G disk and I want to prepare for this
You can use rsyslog and rsyslogd for OS log. For app use flat file, collect using ansible. 😂
Well I'm quite interested in msg stack like grafana, but haven't tried it.
Do you push your logs regularly to a central storage, or do you just SSH into the machines regularly to look at the logs?
Not OP, but I push all the logs to one central syslog server.
If it's OS log,it's pushing https://serverfault.com/questions/522341/how-do-i-setup-rsyslog-to-send-all-logs-to-multiple-remote-servers
If it's laravel/apache, php, then use ansible to pull the log. Or using sentry as I remember. 😂
Make sure that you have logrotate installed and working, to prevent them from piling up.
I've done everything from local syslog to various open source and proprietary log pipelines and also worked on a team dedicated to building a custom log-processing pipeline from scratch in a large environment.
One lesson I've learned is that no matter how nice that web UI is I still want some kind of CLI access and the equivalent of being able to cat, tail and grep logs. In large environments it won't be actually tail-ing a logfile but I want something that can produce a live logstream for piping into Unix text (and JSON) processing tools.