I personally also put Pydantic on the S tier.
Also, I use (geo)pandas on a regular basis and when it comes to geometric operations Shapely is an amazing library.
You might want to consider working either hourly or on a project basis as a contractor. You would have deliverables with deadlines you could meet them on your own time, or simply bill for the time you spend.
You can perhaps look into “midlance” where you have a middle man getting a cut who is responsible for lining up work for you (after which you manage the relationship with the client).
Maybe more common where I live but vacancies will sometimes mention “flexible hours” explicitly, especially remote jobs. Then you can ask them clarify in the interview what their prospective on flexibility looks like.
That’s nice, I think I’ll switch from Firefox ESR on Debian!
Well, it’s a trade off.
Under normal usage my idle CPU load is much higher and my fans are always on, however, in Linux they only turn on under load. I imagine this also ends up in an increase to my utility bill and ultimately the resources I consume.
On the other hand, I recently spent about a week processing data at full CPU load and my system was nearly unusable. For a 12 YO machine I can’t really complain though.
The ideal case would be having the option to easily prioritize processing vs responsiveness.
Crunchbang (#!) linux breathed live into some very wimpy hardware I’ve had in the past.
Loved the minimalism.
In my student years, I always ran with Xubuntu on a used thinkpad.
Although I’m a gnome guy these days, I still need Thunar as my default file manager. It’s nearly perfect…
I run Debian with gnome, headless and raspi and love it.
Used Ubuntu for years, also had a good time and still respect the project even though it deviated from my needs.
Sometimes I’ll boot up something new just to poke around but I’m happy sticking with Debian for the time being.
Desktop: Macintosh (<X) -> Windows (XP-10) w/occasional Ubuntu dual-boot (various DEs) -> Debian + Gnome
Server: Ubuntu LTS -> Debian
I’ve also had a number of used thinkpads over the years where I mostly ran Xubuntu and crunchbang.
I still boot into Windows every month or so if I need to model something in Rhino (CAD). Couldn’t get it working in Wine and my 12 YO computer isn’t performant enough to run it in a VM. The last thread remaining and waiting to be cut…
Yes, only European cities covered by Eurostat. I tried to cover this in the about section but it basically boils down to processing time, my own available time and to a lesser extent storage.
It took me more than a week to process 2013-2023 for the included areas, which is roughly 10TB of raw imagery (with less than 60% cloud cover).
The Eurostat urban extents, for the most part, delineate urban areas with a detailed vector dataset. This is something that I also couldn’t find on a global scale.
I’m not decided yet on expanding the extents, which also depends on if people actually find this useful. However, it is open source (AGPL) so it can easily be forked and adapted.
If you’re willing to share OS/browser that could help :)
I’m on the fence with adding Sentry as I was hoping to keep the project very privacy minded.
Do you mind sharing the OS? This was developed on Firefox (Debian & iOS).
I don’t know if your WebGL is working correctly but I could try to add a check (and thus a more graceful failure mode).
Thank you for the report!
Sorry, you currently need to click to load another area. You can also navigate with the search bar or randomize by clicking the city icon.
I do want to load things automatically but need to figure out how to avoid hogging to much resources for contouring on the users device.
This is the first time sharing this, so a bit of an early release 😅
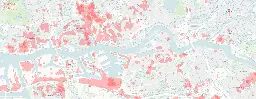
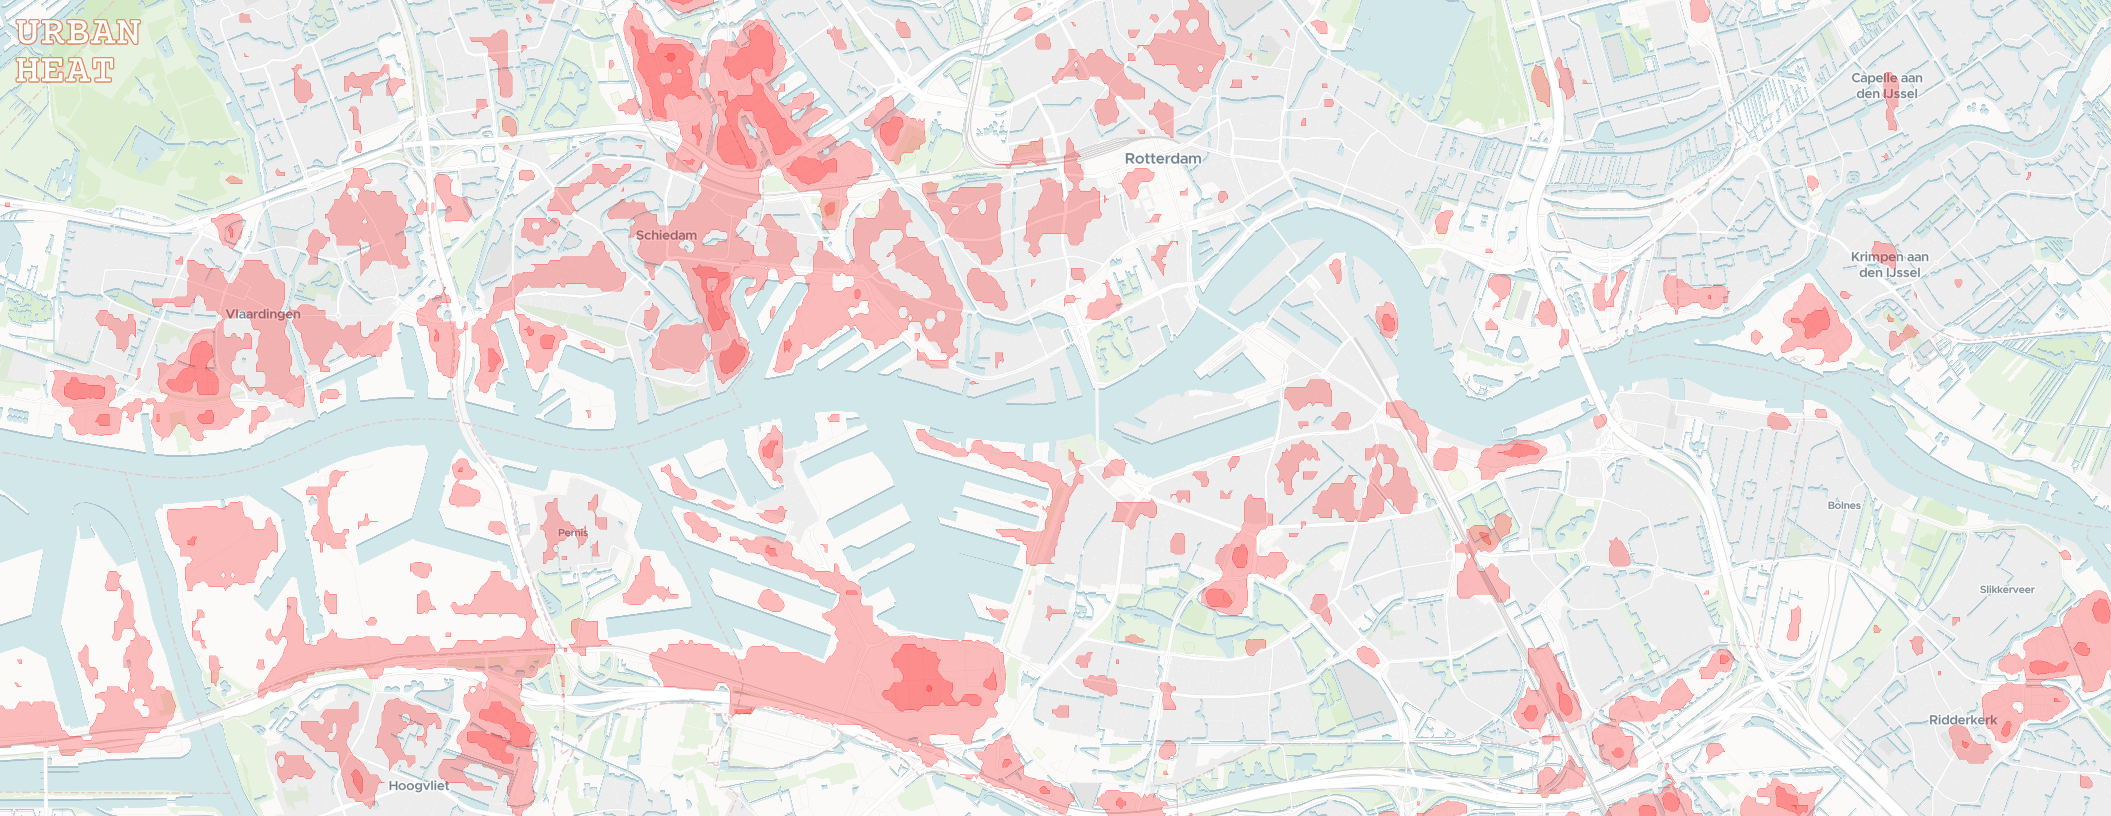
Interactive urban heat island effect visualizations for European cities.
Repo: https://github.com/damienallen/urban-heat
cross-posted from: https://programming.dev/post/14939898
> I wanted to share a small project I've been working on. The goal was to make the data from NASA's Landsat Thermal Infrared Sensor more accessible to the general public. > > I worked with the raw temperature band data to general annual maximum surface temperature raster images for large urban areas covered by the Eurostat GISCO Urban Audit. In the browser, these images are transformed into easier to interpret isotherm contours with some adjustable settings. > > I don't have a specific target audience in mind. The map could help identify areas of refuge for the warmer months, or overheated neighborhoods to avoid as we march towards a toasty future. > > Feedback is welcome :) > > > !
[OC] Urban Heat Island Explorer
Interactive urban heat island effect visualizations for European cities.
repo: https://github.com/damienallen/urban-heat
cross-posted from: https://programming.dev/post/14939898
> I wanted to share a small project I've been working on. The goal was to make the data from NASA's Landsat Thermal Infrared Sensor more accessible to the general public. > > I worked with the raw temperature band data to general annual maximum surface temperature raster images for large urban areas covered by the Eurostat GISCO Urban Audit. In the browser, these images are transformed into easier to interpret isotherm contours with some adjustable settings. > > I don't have a specific target audience in mind. The map could help identify areas of refuge for the warmer months, or overheated neighborhoods to avoid as we march towards a toasty future. > > Feedback is welcome :) > > > !
Urban Heat Island Explorer
I wanted to share a small project I've been working on. The goal was to make the data from NASA's Landsat Thermal Infrared Sensor more accessible to the general public.
I worked with the raw temperature band data to general annual maximum surface temperature raster images for large urban areas covered by the Eurostat GISCO Urban Audit. In the browser, these images are transformed into easier to interpret isotherm contours with some adjustable settings.
I don't have a specific target audience in mind. The map could help identify areas of refuge for the warmer months, or overheated neighborhoods to avoid as we march towards a toasty future.
Feedback is welcome :)
---
EDIT: For UK visitors, sorry to leave you with an empty map...
I've taken a look at older urban extent data and found the geometry I need to process the UK (from before leaving Eurostat). However, there are still some UI limitations to overcome since it seems that cities are split into many boroughs that could only be viewed one at a time. The reason I went with the Eurostat dataset to begin with was a nice delineation of what a city was (for the purposes of this project).
Don't have a timeline, but I do want to add the UK and automatic loading of cities as you pan!
I’m really hoping for the 3D options. If OpenSCAD isn’t a good fit then I still boot to Windows for CAD :(
I’ve had a particularly difficult time with CUDA/Pytorch in WSL. Also with Windows not reclaiming memory…
But don’t get me wrong, WSL has helped a lot when I’ve needed to use Windows at work.
In my experience:
- No lockfile, and using the third party conda-lock is clunky
- Painfully slow solver, although the libmamba solver came to the rescue
- Conda-forge can lag behind pypi by weeks, depending on the package
Interesting, but if I have to use Windows then I would consider Conda depending on my dependency situation.
I don’t particularly like Conda, or Windows, but what I like even less is manually finding wheels for my project. For something like GDAL, I wouldn’t even try on Windows without Conda. I think it’s also easy for a beginner to get up and running with this setup.
My preferred setup is pyenv on Linux with poetry :)