Wykres SARS-Cov2 w warszawskich ściekach [2023-11-06] + tygodniowe dane o testach i zakażeniach z ECDC
Wykres SARS-Cov2 w warszawskich ściekach [2023-11-06] + tygodniowe dane o testach i zakażeniach z ECDC

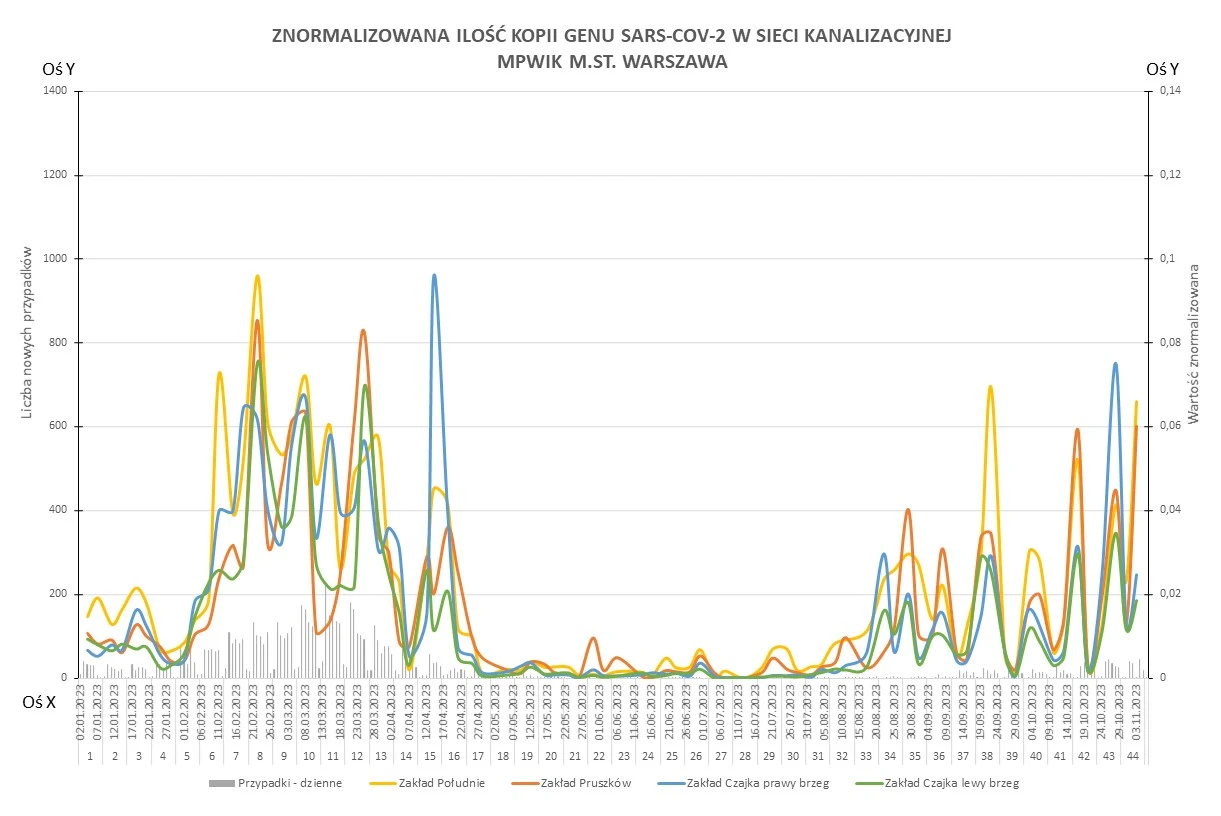
No generalnie to nie jest za dobrze. Mam pewne obawy w związku z obecną sytuacją ponieważ to tylko niewielka część danych jaką molgibyśmy (i imho pownniśmy) mieć dostępną.
Już się praktycznie nie ruszam bez mojej ulubionej maski FFP2 / N95. Odpornosć stadna przy ciągle niejasnej przyszłości Long Covid to dla mnie za mało.
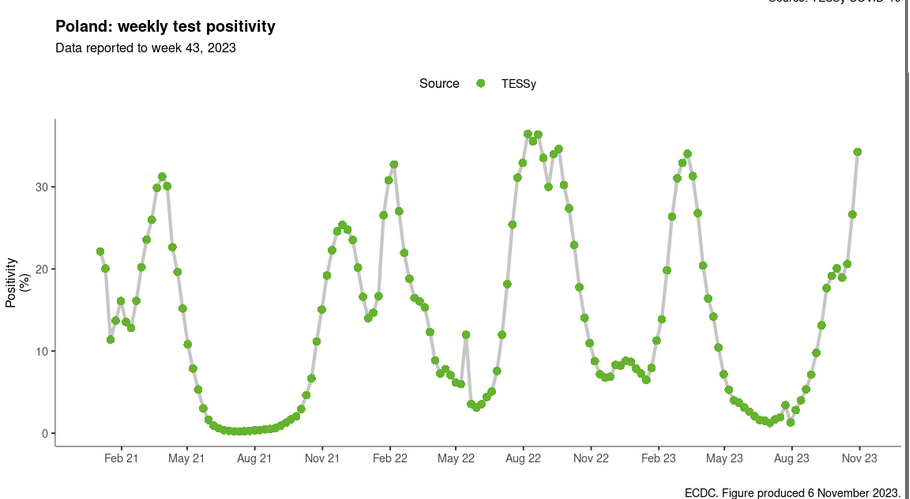
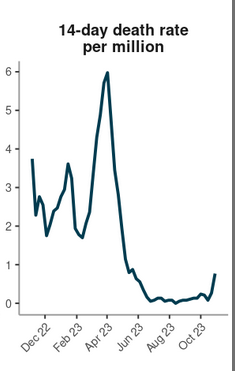
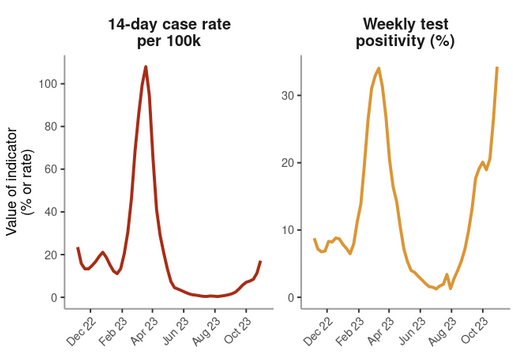
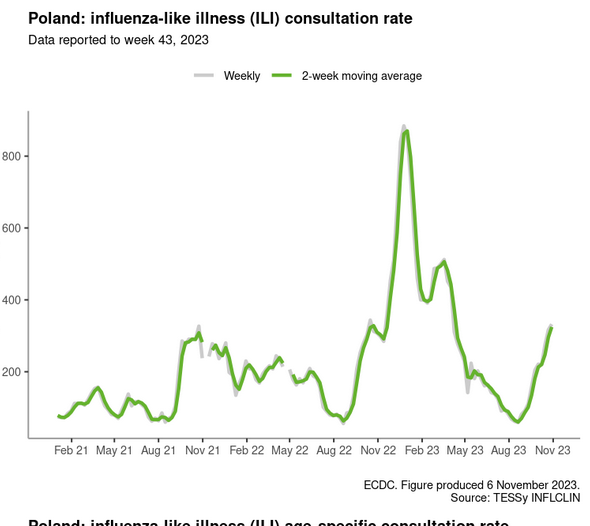
By the end of week 43 (ending 29 October 2023), rates of respiratory illness (influenza-like illness (ILI)/acute respiratory infection (ARI)) in the community were at expected levels for this time of the year in most EU/EEA countries and were driven in part by SARS-CoV-2 transmission. Increases in case counts continued to be reported, most notably among older age groups. This has translated into sustained increases in hospital or ICU admissions and deaths in some EU/EEA countries.
Consultation rates of patients presenting to sentinel general practitioners with respiratory illness (ILI/ARI) were reported by 20 countries up to week 43. Rates remained at similar levels to those observed in the same period last year in most EU/EEA countries. Fifteen countries reported data on testing for SARS-CoV-2 in these settings, with a pooled test positivity of 20% (median of country values: 21%; IQR: 16–27%).
![Wykres SARS-Cov2 w warszawskich ściekach [2023-11-06] + tygodniowe dane o testach i zakażeniach z ECDC](https://szmer.info/pictrs/image/24a83798-68fc-49d3-b39c-8378611723ff.jpeg?format=webp&thumbnail=196)
![Wykres SARS-Cov2 w warszawskich ściekach [2023-11-06] + tygodniowe dane o testach i zakażeniach z ECDC](https://szmer.info/pictrs/image/94ebe519-2651-4def-abf4-6c0f4d6df578.jpeg?format=webp&thumbnail=196)