Data is Beautiful
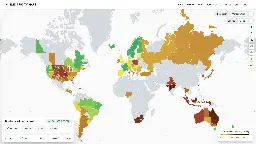
- app.electricitymaps.com Live 24/7 CO₂ emissions of electricity consumption
Electricity Maps is a live 24/7 visualization of where your electricity comes from and how much CO2 was emitted to produce it.
-
Tour de France 2024 stage profiles
Source:https://stevenmarcscott.substack.com/p/tour-de-france-2024-stage-profiles?r=3qls9
-
One third of the population of Switzerland lives within 5 kilometers of the main train line crossing the country
Source (yes sorry it's LinkedIn, if you any another one, I'll update): https://www.linkedin.com/posts/prof-stefan-michel_notsweden-train-activity-7210174690827370496-8iJz?utm_source=share&utm_medium=member_ios
-
Parent/Child Height Relationships - Regression toward the Mean
Source of data: https://dataverse.harvard.edu/dataset.xhtml?persistentId=doi:10.7910/DVN/T0HSJ1
Edit: removed OC as it's not (sorry)
-
Wikipedia graph for generational spans over time
Not the prettiest graph, but a neat way of putting all this information into one image.
Wiki Commons page: https://commons.m.wikimedia.org/wiki/File:Generation_timeline.svg#mw-jump-to-license
Wikipedia page on Generations: https://en.wikipedia.org/wiki/Generation
-
Concentrated animal feeding operations (CAFOs) by county in Michigan, USA
Data from:
- TIGER/Line Shapefile, 2020, State, Michigan, County Subdivisions
- Michigan Concentrated Animal Feeding Operations (CAFOs)
Map created using QGIS, a free and open source geographic information system.
Color blind friendly color palette selected using ColorBrewer 2.0.
-
Annual wine production in France
Source: https://www.douane.gouv.fr/la-douane/opendata/mots-cles/recolte
Be careful, numbers are department numbers, not quantity of wine (which is represented by the color)
-
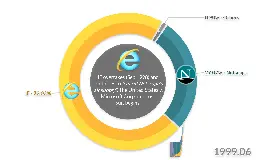
Desktop Browsers Market Share
plotapi.com Desktop Browsers Market Share | PlotAPI.comIn this project we're going to use PlotAPI to visualize desktop browser market share over time. We're going to use data that has been published by multiple sources for different periods, as there is no single data source that covers everything. Browsers that did not have significant market share hav...
-
Took thousands of hip hop lyrics, combined them into one file and then analyzed that text using Python for networks of rhyming words. Which is what you see here in this map. Lot's of fun.
> I sourced the data from dozens of 90s hip hop songs. Then used Python to analyze that file, and D3 to visualize the information. Here is a GitHub repo with the code I used. And here is a YouTube video exploring that code and how it all works together.
I'm not the original author. But I thought it was cool and thought it should live on Lemmy.
-
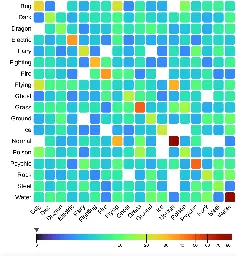
Pokémon Type Co-Occurrence (Gen 1-9)
plotapi.com Pokémon Types (Gen 1-9) | PlotAPI.comIn this project we're going to use PlotAPI to visualize the co-occurrences between Pokémon types. We're going to use Pokémon (Gen 1-9) data, a fork of which is available in @shahinrostami's GitHub.
-
When the fuck did we start singing "shit"?
Source: https://chrisdallariva.substack.com/p/when-the-fck-did-we-start-singing
-
Average number of marriages per day, England and Wales
Source: https://www.ons.gov.uk/peoplepopulationandcommunity/birthsdeathsandmarriages/marriagecohabitationandcivilpartnerships/datasets/marriagesinenglandandwales2013
-
The Next Characters to Enter the Public Domain
Source: https://www.visualcapitalist.com/next-characters-to-enter-the-public-domain/
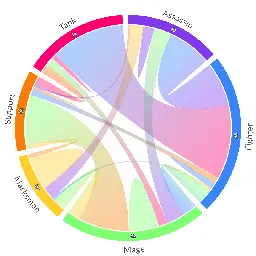
- plotapi.com League of Legends Class Combinations | PlotAPI.com
In this project we're going to use PlotPanel to visualise the co-occurrences between League of Legends classes. We're going to use League of Legends Champion data from version 12.4.1, a copy of which is available through the Riot Games API.
-
First post - looking for mods!
Hello everyone,
Following this discussion we decided to create this new community.
As it's usually best practice to share moderation, feel free to let me know if you would be interested in modding this community.
I hope there wouldn't be too much work necessary, people are usually just here to enjoy nice data visuals.